

21st Century Incubator - Monitoring and Alerting
15 June 2017In the previous post, I explained how the incubator was created and what features it consisted of. Read here if you are interested: 21st Century Incubator - Part 2 - How its made
The feature which I found particularly handy and interesting was the use of metrics, monitoring and alerting. So i've dedicated a post here to explain further regarding this.
Getting stats out of the Incubator
I wanted to send stats like temperature and humidity out of the Incubator however the Arduino does not have any WiFi functionality. I made use of a Raspberry Pi which was unused since I bought it. The Pi was connected via USB to the Arduino.
This is how sending stats out of the Arduino works:
- Arduino outputs JSON to it's Serial which looks like this:
{ "temperature": 37.5, "humidity": 45, "runtime": 45312356432, "turner": 1, "light_enabled": 1, "turner_enabled": 1 } - The Raspberry Pi reads the Serial output from the Arduino and sends this data as a HTTP request to an external service which records these stats in a time series database. Prometheus was used for this.
- The graphing software (Grafana) queries these stats to render beautiful dashboards and notify of any issues according to alerts you setup.
Monitoring
As mentioned before, Grafana was used with Prometheus as a data source as the monitoring solution for the incubator.
This ended up working really well and I was able to monitor the incubator from anywhere. The dashboard looks like this:
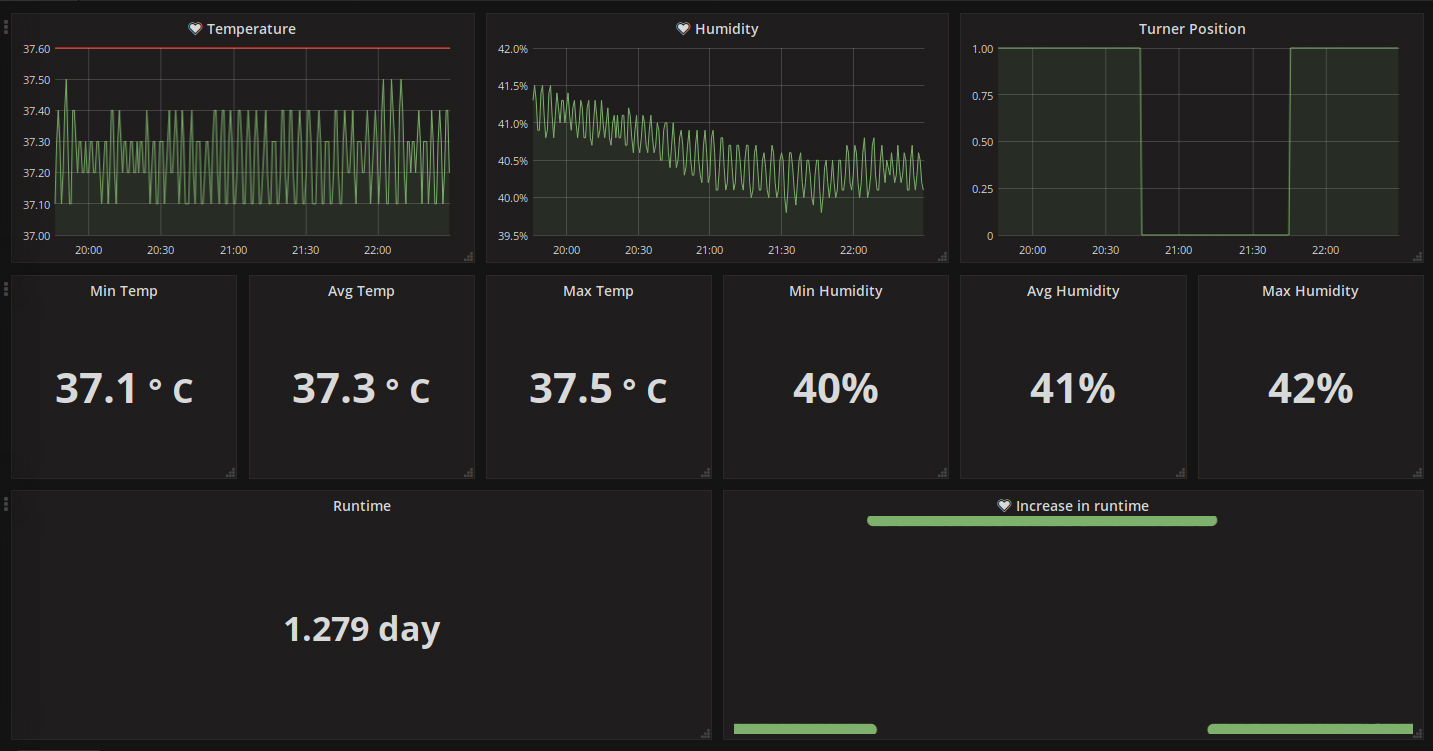
- Temperature - We want to monitor the temperature to ensure that it does not in reality sway from the desired temperature. It is a very common issue among incubators that the temperature maintained does not reflect the temperature that was set. With a graph of the temperature and accompanying calculations, we can tell exactly what temperature is really being applied
- Humidity - Humidity does not need to be maintained as accurately as the temperature however it does need to be within a certain range and deviating from this can kill the egg.
- Turner position - The position of the turner is displayed for convenience and to display the frequency of the turning.
- Runtime - This metric is how long the incubator has been running. It is common that the incubator will have an issue and will be automatically restarted so this lets us see if there were any issues recently.
- Increase in Runtime - This reports how much the runtime has increased in the last five minutes. When the Incubator is not running or statistics are not reaching the server for whatever reason, the runtime metric will not be updated and will remain constant. Therefore this metric effectively reports whether the Incubator is healthy
Alerting
I have a life and so cannot sit glued to the dashboard 24/7 (Ok maybe I did) so even more useful than seeing this data on a graph is being told about it based on certain conditions. This is where Grafana's alerting feature delivers. Here are the alerts that were setup:
- Temperature more than 37.7 or below 36.7
- Humidity above 55% or below 30% during the first 14 days
- Humidity above 75% or below 60% during the last 3 days
- Increase in runtime dropping to 0 (incubator not running or metrics not reaching the service)
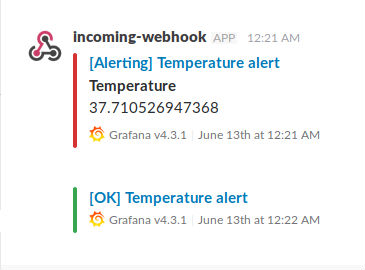
Grafana notifies you via the desired channel (in my case Slack) if the conditions you set have been hit and when the issue resolves. Here's an example:
Incidents
So you are probably wondering what went wrong and how the alerts helped. One thing I'm quite proud of is that no time in 17 days that the incubator was running did it mis function. However several incidents did happen:
Incident #1 - Incubator is not running alert
A few days after the incubation began, I woke up at 4 AM to an alert saying that the incubator was not running. I ran into the room expecting a fire (you know my electronics) but all I saw was a perfectly functioning incubator... What the hell?
Problem: It turns out that all the architecture around sending metrics through to the graphs is less robust than the incubator is. The application that collects the data had ran out of memory on the server and exited.
Solution: Run the applications in a way that would auto restart in case of any failures.
Incident #2 - Temperature too high, Temperature too low, Repeat
Problem: Every few hours I would receive an alert for the temperature going above or below the thresholds momentarily. Mini heart attacks ensued until I started to ignore it.
Solution: Modifying the alert to trigger based on an average of the last few minutes instead of the latest reading.
Incident #3 - Humidity sudden increase
Humidity gradually increases however I suddenly saw a 20% jump in humidity in a very short time period. This was very strange until I realised that an egg had hatched and created a spike in humdiity
Funnily, I started to watch for this pattern on the graphs and was able to catch the last egg hatching. Another win for our graphs!